All 1,943 Cornell Faculty were asked to respond to the following question:
Of the many charts (graph, map, diagram, table and ‘other’) you have seen in your life, which has been the most important, remarkable, meaningful or valuable?
On the archival paper provided, they were asked to create a copy of the chart and in the remaining space annotate notable attribute of the data and the image, describe what they remembered about first seeing this image and comment on why they chose this image.
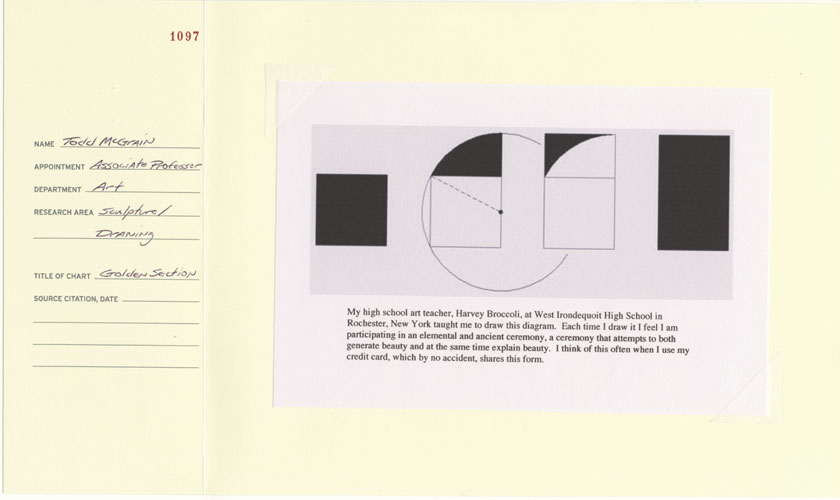
Title: Golden Section
By Todd McGrain:
My high school art teacher, Harvey Broccoli, at West Irondequoit High School in Rochester, New York taught me to draw this diagram. Each time I draw it I feel I am participating in an elemental and ancient ceremony, a ceremony that attempts to both generate beauty and at the same time explain beauty. I think of this often when I use my credit card, which by no accident, shares this form.
This week, at this point in time, right about now, this year, in these very exciting times, my favorite chart has been this:
Vizualize Its Meaning.

1 comment:
I only have two.
Post a Comment